Analytics for every angle of your workspace.
From occupancy heatmaps to tenant retention. All the data your building needs, in one place.
Space usage analytics
See exactly how every zone, floor and desk is being used across your buidling. Identify underused areas before they start costing you money.

Pre-built dashboards
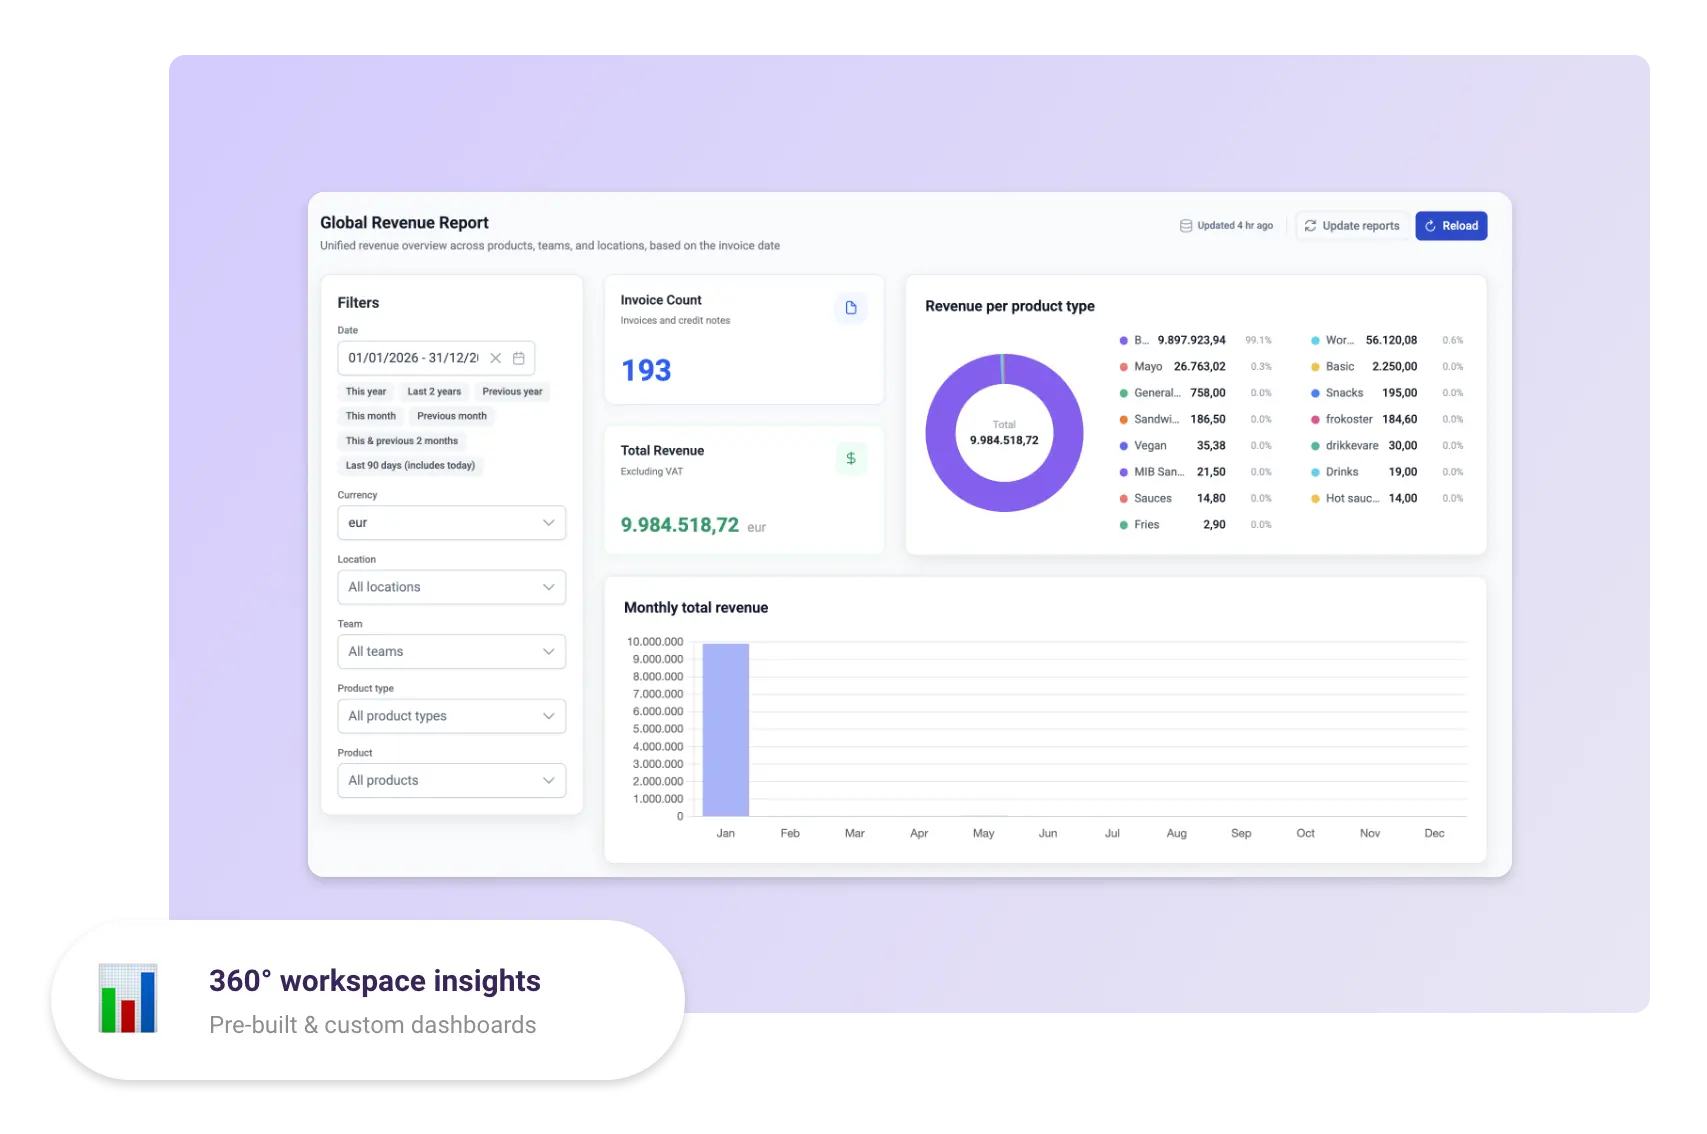
Get started immediately with ready-to-use dashboards covering the metrics that matter most: occupancy rates, peak hours, booking trends, and revenue per square metre.
Custom dashboards
Build your own views to track the specific KPIs your building or portfolio requires. Filter by location, tenant type, or time period and save views for quick access.

Member & visitor behaviour
Understand how tenants and visitors actually move through your building. Which spaces they prefer, when they arrive, and where friction points occur in their experience.

Predictive insights
Go beyond historical data with predictive analytics. Spot emerging patterns and get ahead of capacity issues, demand spikes, and tenant behaviour shifts before they become problems.

Member retention tracking
Monitor engagement signals and identify tenants at risk of churning. Your team can act early, have the right conversations, and keep your occupancy rate where it belongs.
📊 DASHBOARDS
All your data. One clear view.
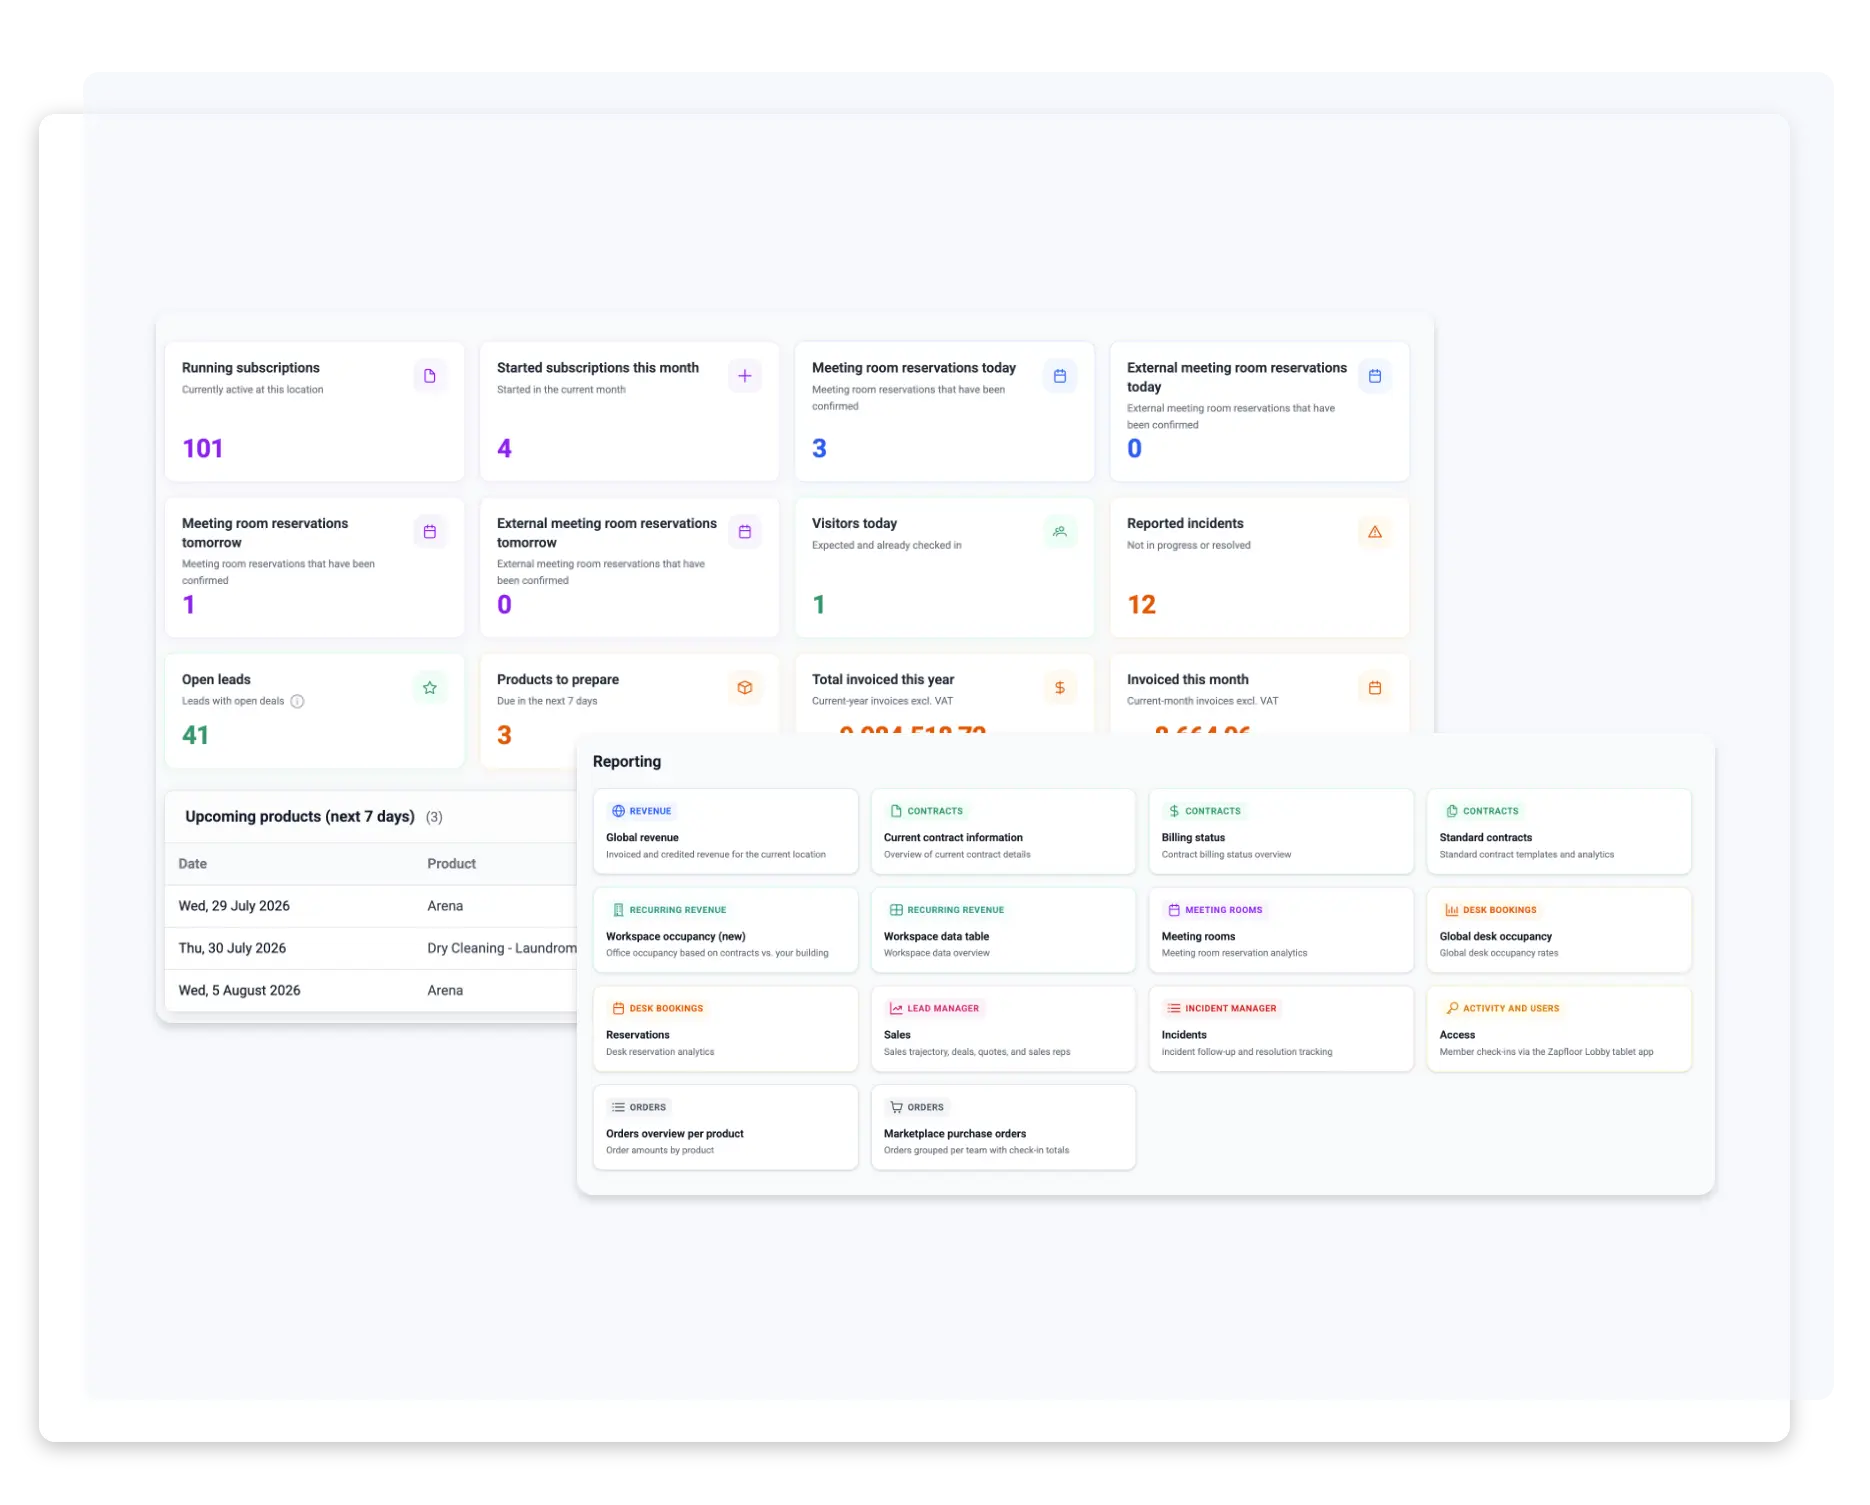
Zapfloor pulls together data from across your entire building (bookings, check-ins, revenue, occupany), and presents it in clear, actionable dashboards your whole teal can actually use. No data exports, no pivot tables.
Live occupancy and booking data across all locations
Pre-built reports for the most common use cases
Custom dashboards for your specific KPIs
Exportable reports for stakeholders and asset managers
Easy-to-read format. Built for operators, not data scientists
Data that drives real decisions.
Good analytics don't just tell you what happened. They tell you what to do next.
Reduce operating costs
Identify underused spaces and make informed decisions about how to repurpose, consolidate, or re-price them.
Optimise your space layout
Real occupancy data tells you which zones are overcrowded and which sit empty. Reconfigure your building around how people actually use it.
Improve tenant satisfaction
When you understand how tenants use your building, you can fix friction before they feel it, and show them the value they're getting from the space they pay for.
Report with confidence
Give asset managers and stakeholders the clear, exportable reports they need. No more spending hours pulling data from multiple sources or building spreadsheets by hand.